Dive Brief:
-
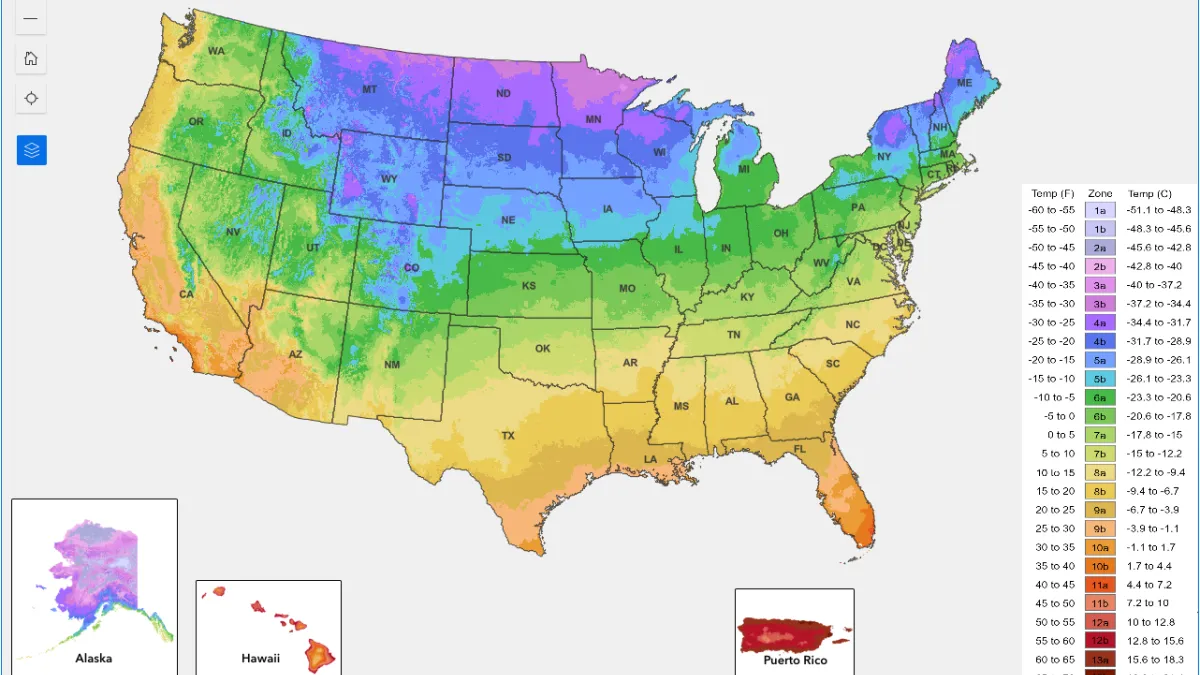
For the first time in more than a decade, the U.S. Department of Agriculture released an updated version of a climate map that aims to help gardeners, growers and researchers determine what plants can thrive across the country.
-
The revised Plant Hardiness Zone Map, developed in collaboration with Oregon State University’s Climate PRISM group, is more accurate and contains greater detail than previous versions, according to USDA.
-
The 2023 map shows that more than half of the country has experienced warmer temperatures, but with greater data sets than the agency has ever used. The new numbers reflect those huge data points and aren’t reflective of just global climate change.
Dive Insight:
The USDA’s Risk Management Agency uses the Plant Hardiness Zone Map to set some crop insurance standards for farmers and acts as a guide for home gardeners and planters. Scientists also use the data to show which insects, weeds or diseases may spread.
“Overall, the 2023 map is about 2.5 degrees warmer than the 2012 map across the conterminous United States,” Christopher Daly, director of the PRISM Climate Group and the map’s lead author, said in a statement. “This translated into about half of the country shifting to a warmer 5-degree half zone, and half remaining in the same half zone. The central plains and Midwest generally warmed the most, with the southwestern U.S. warming very little.”
While the map has been getting attention, it mostly confirms what most growers already know.
“In a way, it’s not a big deal because we already recognize it is happening. The map reflects our on-the-ground reality,” Pati Vitt, director of natural resources for the Lake County Forest Preserve District told Chicago’s WTTW. “What is a big deal is for the USDA to acknowledge the change.”
Compared to the last version released in 2012, there are a number of improvements to the map, including more detailed geographic information and temperature ranges. The map also incorporates data drawn from 13,412 weather stations, nearly double the amount used in the previous map.
Furthermore, the 2023 map is based on 30-year averages for the lowest annual winter temperatures in locations across the U.S. from 1991 to 2020. The 2012 version was based on estimates from 1976 to 2005.
The addition of new stations and more sophisticated mapping techniques led to a more accurate and detailed map but also “produced localized changes that are not climate related,” Daly said in a statement.
The map is divided into 13 zones, each representing a range of 10 degrees Fahrenheit. Each zone is further divided into two half zones, representing a 5-degree range.
In addition to the map updates, there is a new “Tips for Growers” section that provides information about USDA research programs that might be of interest to gardeners and others who grow and breed plants.


